+ - 0:00:00
Notes for current slide
Notes for next slide

FundRmentals 01

Dr Danielle Evans | University of Sussex

1 / 23

Session Overview

Part 1: Course Overview

  • What even is R & why are you making me learn it?

  • Introduction to the fundRmentals course

  • The R-cult: why R is ⭐magical

Part 2: Getting StaRted

  • Tips for success

  • Next steps

  • Installing R & RStudio

2 / 23

Part 1: Course Overview

3 / 23

What even is R anyway? 🤔

  • R is a programming language where we can talk to our computer & tell it what to do...
print("Hi LearneRs!")
## [1] "Hi LearneRs!"
  • RStudio is a more user-friendly interface where we can use R

4 / 23

Introduction to fundRmentals

Course Structure

  • Weekly tutorials to do in your own time

  • Weekly 'HappyHouR' practical sessions


Course Aims

  • Gain solid understanding of the 'fundRmentals'

    • Feel confident supervising project students using R

    • Feel inspired to use R/RStudio for your own projects

FundRmentals Webpage:

5 / 23

The R-cult: why R is ⭐magical

  • Makes complicated things easy to do

  • Super efficient

  • Collaboration

  • Reproducibility

  • Visualisations

  • Modelling

  • Reporting

  • Presenting

  • & sooo many other cool things!!

6 / 23

A very simple regression

  • 1 line of code, much quicker than clicking in SPSS:
lm(outcome ~ predictor, data = data)
7 / 23

A very simple regression

  • 1 line of code, much quicker than clicking in SPSS:
lm(outcome ~ predictor, data = data)


"But Dan, what if I have 10 predictors?"

  • Still just 1 line of code...
lm(outcome ~ predictor_1 + predictor_2 + predictor_3 + predictor_4 + predictor_5 + predictor_6 +
predictor_7 + predictor_8 + predictor_9 + predictor_10, data = data)
8 / 23

A very simple regression

  • 1 line of code, much quicker than clicking in SPSS:
lm(outcome ~ predictor, data = data)


"But Dan, what if I want to do a t-test?"

t.test(outcome ~ grouping_variable, data = data)

"Or a correlation?"

cor.test(~ variable_1 + variable_2, data = data)
9 / 23

A very simple regression

  • 1 line of code, much quicker than clicking in SPSS:
lm(outcome ~ predictor, data = data)


"But Dan, what if I have a factorial design?"

  • Still just 1 line of code...
lm(outcome ~ predictor_1*predictor_2, data = data)
10 / 23

A very simple regression

  • 1 line of code, much quicker than clicking in SPSS:
lm(outcome ~ predictor, data = data)


"But Dan, what if I have a stupidly complex model?"

11 / 23

A Gross Latent Growth Model

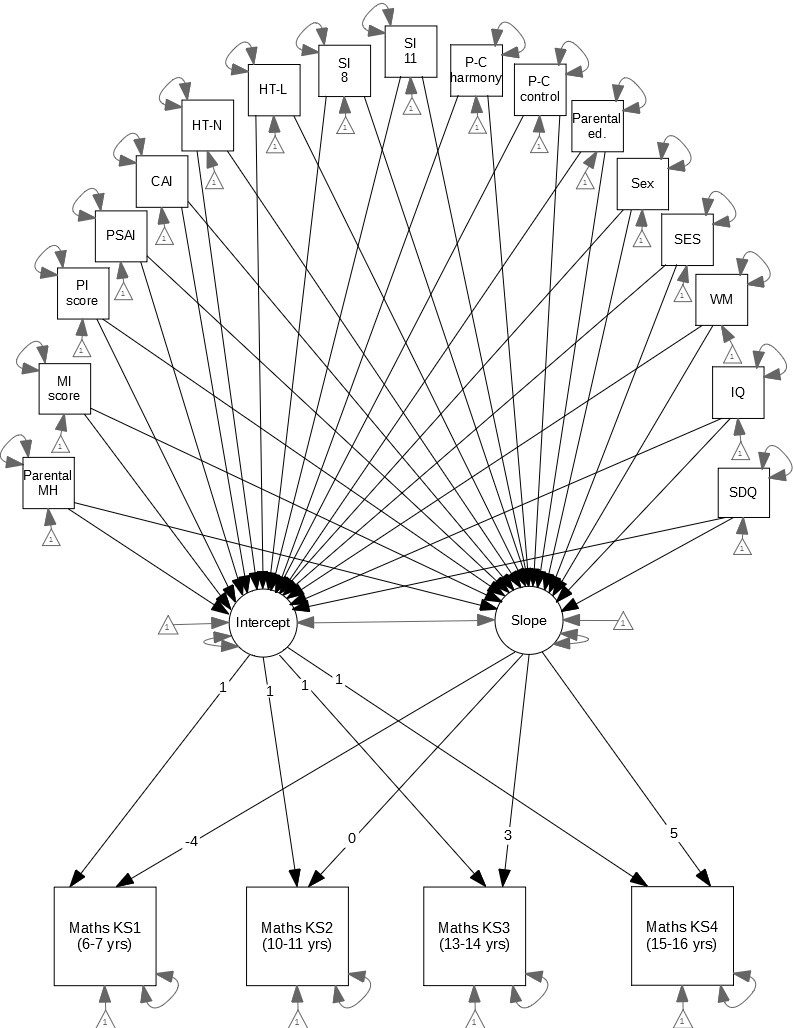
  • Just 5 lines of code for this monstrosity:
model <- "i =~ 1*sat140 + 1*ks2_mat + 1*ks3_mat + 1*ks4_maths
s =~ -4*sat140 + 0*ks2_mat + 3*ks3_mat + 5*ks4_maths
i ~ sex + int_sdq_11 + iq_cent + wm_cent + ses_cent + cse_voc + cse_olevel + cse_alevel + cse_degree + par_mh_fa + mum_home_int + part_home_int + cai_cent + psai_cent +
home_teach_1_al + home_teach_1_nu + schl_supp_sa + schl_supp_se + eas_harmony + eas_control
s ~ sex + int_sdq_11 + iq_cent + wm_cent + ses_cent + cse_voc + cse_olevel + cse_alevel + cse_degree + par_mh_fa + mum_home_int + part_home_int + cai_cent + psai_cent +
home_teach_1_al + home_teach_1_nu + schl_supp_sa + schl_supp_se + eas_harmony + eas_control"
growth(model, data = data, estimator = "MLR")
12 / 23

Data Viz: A Pretty, Plain, APA Scatterplot

ggplot(data, aes(x = flipper_length_mm, y = body_mass_g)) +
geom_point() +
labs(x = "Flipper Length (mm)", y = "Body Mass (g)") +
theme_apa()

13 / 23

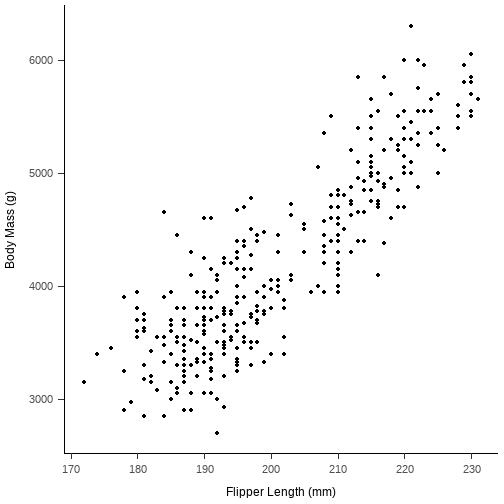
Data Viz: Grouped Scatterplot

ggplot(data, aes(x = flipper_length_mm, y = body_mass_g, colour = island)) +
geom_point() +
labs(x = "Flipper Length (mm)", y = "Body Mass (g)", colour = "Island") +
theme_apa()

14 / 23

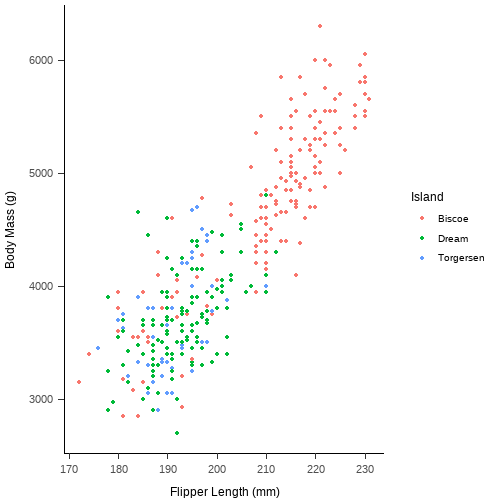
Data Viz: sCATterplot

ggplot(data, aes(x = flipper_length_mm, y = body_mass_g)) +
geom_cat(cat = "lil_bub", size = 2) +
labs(x = "Catnip Consumed", y = "Happiness") +
theme_apa()
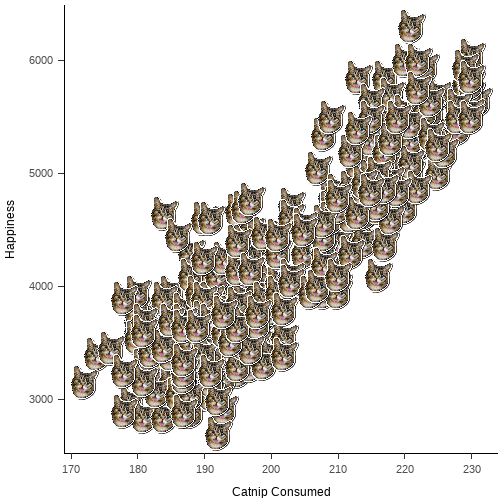
15 / 23

RMarkdown

  • Combine code (analyses, plots etc.) & text in one document

  • Great for writing notes about your analyses or for creating nicely formatted word docs/htmls/pdfs etc.

  • Super useful for writing journal articles, dissertations & theses

  • Additional packages (papaja & rticles) for apa style/journal formatting

  • Most (if not all) students will use RMarkdown for their analyses

16 / 23

Inline Code

  • Allows you to include code within the main text of your document

  • Can be used with test results, values from tables etc.

  • Any values will be automatically updated when you render the file

  • Incredibly useful & efficient

  • Helps you avoid tYpos & rounding erroRs


The final sample consisted of `r nrow(data)` participants.

The final sample consisted of 500 participants.

17 / 23

You can create beautiful slides like these...

18 / 23

You can create super cool websites... 😉

19 / 23

Part 2: Getting StaRted

20 / 23

Tips for Success

For Supervision...

Number 1 rule: don't panic! We've all got this!!

  • Students have access to everything we've covered thus far on Canvas
  • They are equipped to be able to do their analyses - they just don't know it
  • They'll also have access to an R helpdesk next semester & two analyses workshops

For Yourself...

  • Practice as often as you can
  • Be kind to yourself - it feels really slow & confusing when you first start
  • Ask questions, often someone else explaining it slightly differently makes everything click
  • There's a huge online community of R users, for any problems/errors you're having the solution can usually be found quite easily by searching
  • Google is your best friend
21 / 23

Next Steps

Complete the tutorial before our first HappyHouR next week, which covers:

  • Installation & tour of RStudio

  • Working in RStudio

  • Installing & loading packages

  • RMarkdown

  • Getting data into RStudio

  • Tables in RMarkdown

22 / 23

Installing R & RStudio Walkthrough

23 / 23

Session Overview

Part 1: Course Overview

  • What even is R & why are you making me learn it?

  • Introduction to the fundRmentals course

  • The R-cult: why R is ⭐magical

Part 2: Getting StaRted

  • Tips for success

  • Next steps

  • Installing R & RStudio

2 / 23
Paused

Help

Keyboard shortcuts

, , Pg Up, k Go to previous slide
, , Pg Dn, Space, j Go to next slide
Home Go to first slide
End Go to last slide
Number + Return Go to specific slide
b / m / f Toggle blackout / mirrored / fullscreen mode
c Clone slideshow
p Toggle presenter mode
t Restart the presentation timer
?, h Toggle this help
Esc Back to slideshow