FundRmentals 07
Dr Danielle Evans | University of Sussex
Setup & Q&A
- Open RStudio
- Open your fundRmentals R Project (click the blue cube in the top right corner of RStudio)
- Open a new Rmd file for today
- Install the palmerpenguins package by running the code below in the console:
install.packages("palmerpenguins")- In a new code chunk, load tidyverse & palmerpenguins using the library() command
- In another code chunk, create peng_data by copying the below code:
peng_data <- palmerpenguins::penguinsAny questions from the last tutorial?
Overview
ggplot2
Scatterplot
Means plot
Next steps
ggplot2
ggplot2 is a really useful package (part of tidyverse) for data visualisation
We use the ggplot2::ggplot() function to create plots
Plots are built in layers from 3 key components: data, coordinate system, & geometric elements (geoms)
Plots created with ggplot2 are super customisable, you can make pretty much anything you can imagine
Because it's pretty much unlimited, there is a huge amount of resources online & there is no need to memorise everything, we can easily look it up!
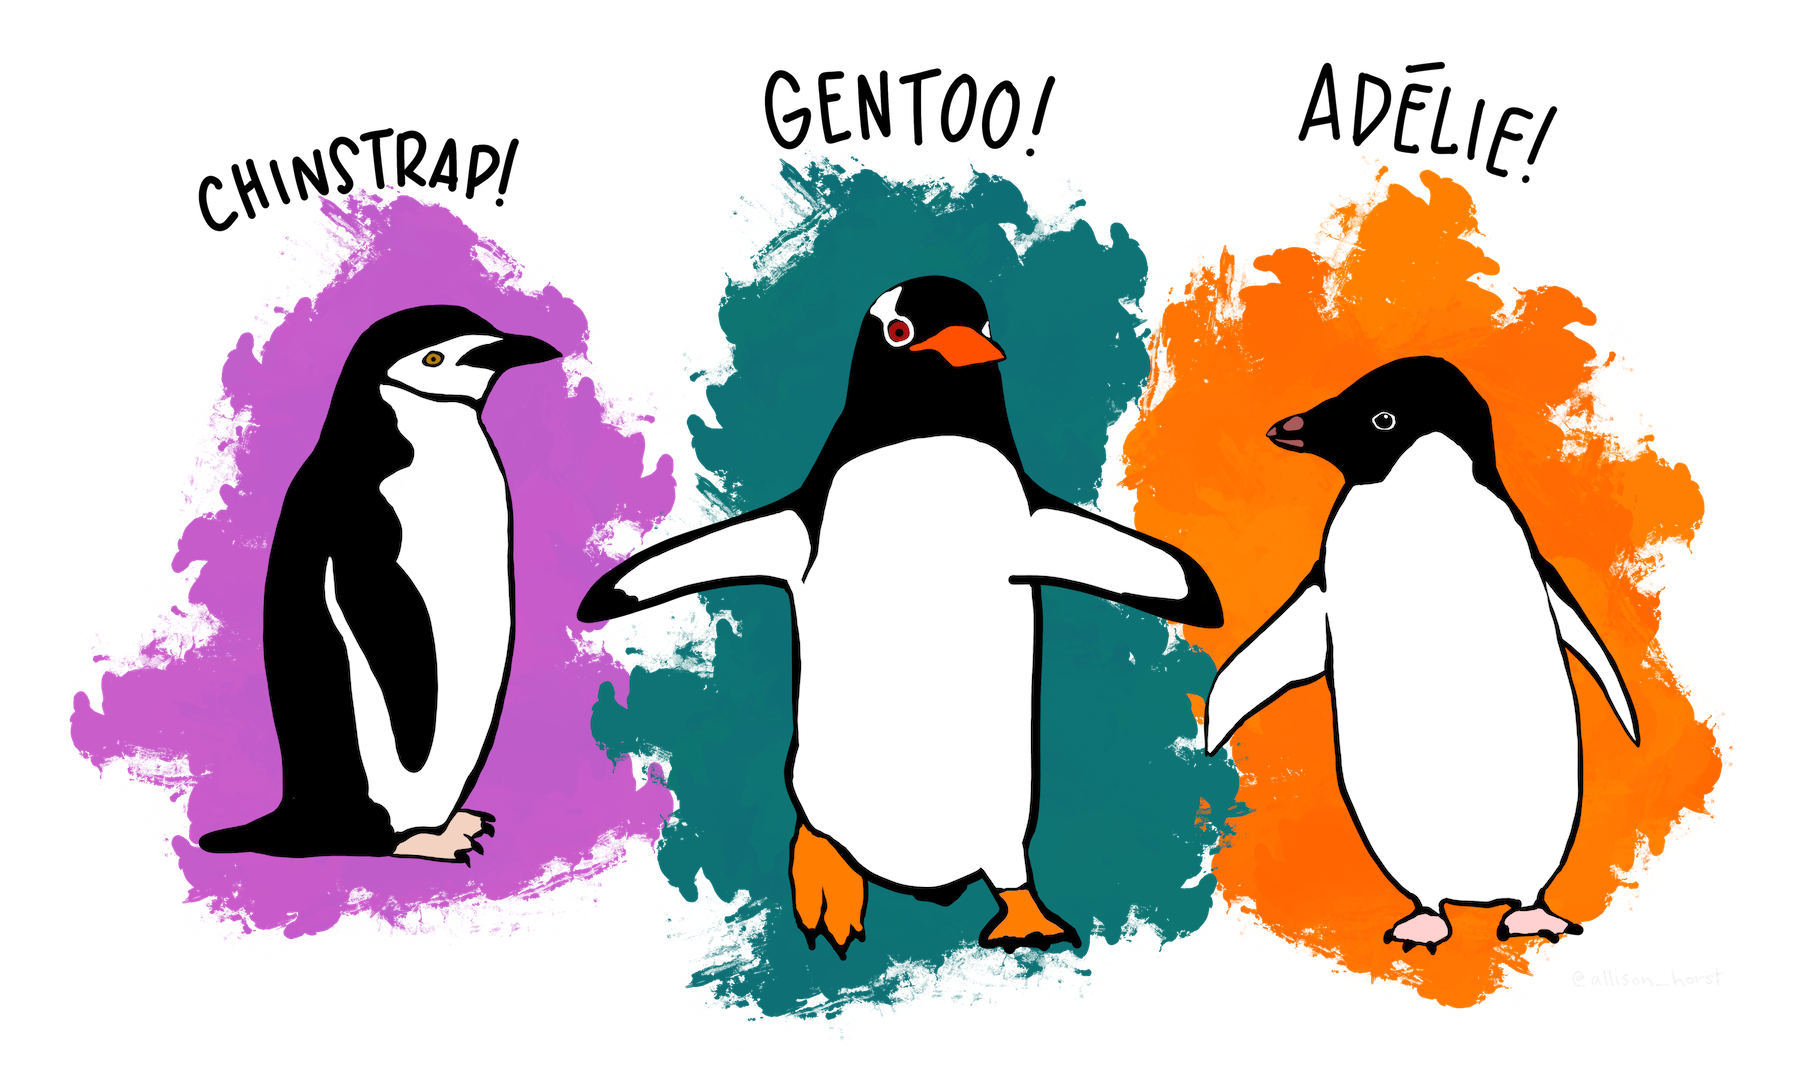
Today we're going to try creating a few plots with the palmerpenguins data!
ggplot2::ggplot()
Built layer by layer +
Variables are mapped onto elements of the plot as 'aesthetics'
- We use aes() to include variable(s) as an aesthetic
Geoms are 'visual marks' that represent data points e.g.
geom_bar() – creates a layer of bars
geom_point() – creates a layer of data points
geom_histogram() – creates a layer with a histogram
geom_text() – creates layer with text on
& many more options...
Plot Building Process
Create base layer by specifying the data & the variables to map onto the plot
Add geom layer (to display our data points)
Add/edit visual properties (scale, colours, shapes etc.)
Add semantic properties (e.g. title, labels)
Add a theme to make our plot pretty
Scatterplots
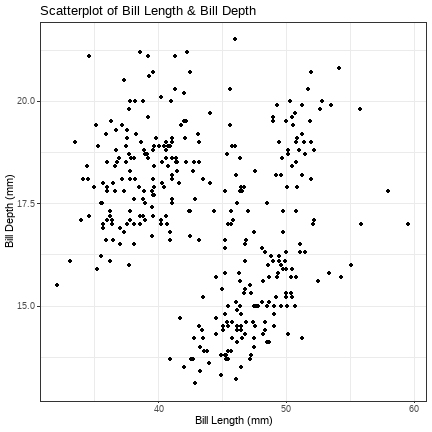
peng_scatter <- ggplot2::ggplot(peng_data, aes(x = bill_length_mm, y = bill_depth_mm))peng_scatter + geom_point() + labs(title = "Scatterplot of Bill Length & Bill Depth", x = "Bill Length (mm)", y = "Bill Depth (mm)") + theme_bw()
Task: Create a scatterplot of peng_data with body_mass_g on the x axis, flipper_length_mm on the y axis
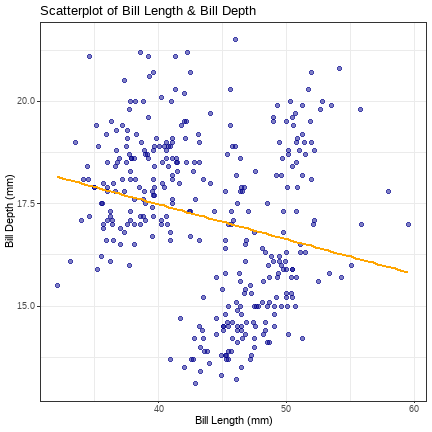
peng_scatter <- ggplot2::ggplot(peng_data, aes(x = bill_length_mm, y = bill_depth_mm))peng_scatter + geom_point(colour = "dark blue", size = 3, shape = 20, alpha = .5) + geom_smooth(method = "lm", se = FALSE, colour = "orange") + labs(title = "Scatterplot of Bill Length & Bill Depth", x = "Bill Length (mm)", y = "Bill Depth (mm)") + theme_bw()We can make it more fancy by changing the colour, size, shape & alpha (transparency) of the points, & by adding a regression line (the geom_smooth layer)
Task: Edit your previous scatterplot by changing the different options for displaying the points & add a regression line
Means Plots
peng_means <- ggplot2::ggplot(peng_data, aes(x = species, y = flipper_length_mm))peng_means + stat_summary(fun = "mean", geom = "point", size = 4, colour = "orange") + labs(title = "Mean Flipper Length per Penguin Species", x = "Species", y = "Flipper Length (mm)") + theme_minimal()
Task: Create a means plot of peng_data with island on the x axis, body_mass_g on the y axis
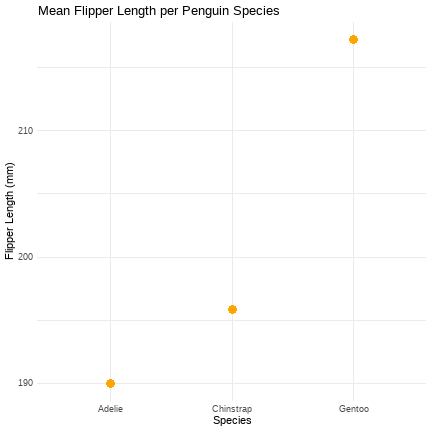
n the stat_summary() function, we’re asking to calculate the means (fun = “mean”). The argument geom = “point” asks ggplot2 to display the means as dots using geom_point().
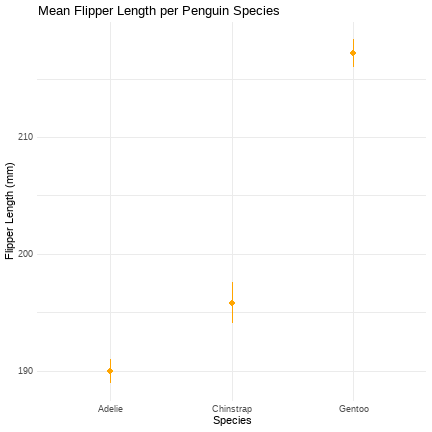
Adding CIs
peng_means <- ggplot2::ggplot(peng_data, aes(x = species, y = flipper_length_mm))peng_means + stat_summary(fun.data = "mean_cl_normal", geom = "pointrange", colour = "orange") + labs(title = "Mean Flipper Length per Penguin Species", x = "Species", y = "Flipper Length (mm)") + theme_minimal()
Task: Edit our means plot to display confidence intervals
Changing the Coordinate System
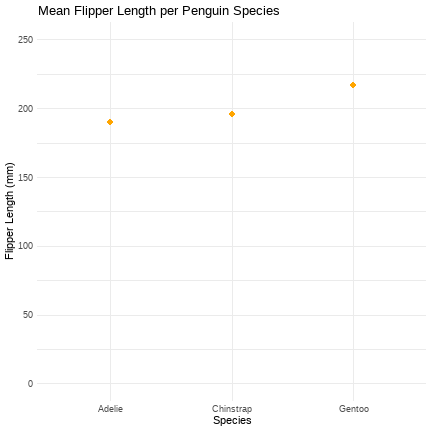
peng_means <- ggplot2::ggplot(peng_data, aes(x = species, y = flipper_length_mm))peng_means + stat_summary(fun.data = "mean_cl_normal", geom = "pointrange", colour = "orange") + labs(title = "Mean Flipper Length per Penguin Species", x = "Species", y = "Flipper Length (mm)") + coord_cartesian(ylim = c(0, 250)) +scale_y_continuous(breaks = seq(0, 250, 50)) + theme_minimal()
Task: Using the means plot in the previous task, alter the y axis & add appropriate scale breaks (use your judgement here for what would be appropriate)
Top Tips
- Run & inspect every change you make
- Be aware that creating plots with ggplot is often a long process
- A really common error is forgetting the + for each layer
- Set code chunk options to echo = FALSE (plot is displayed but the code isn't):

Next Steps
Save the RMarkdown document from today Ctrl + S or Command + S
For next week you should complete the discovr_09 tutorial on comparing means by pasting the below code into the Console in RStudio, pressing Enter
learnr::run_tutorial("discovr_09", package = "discovr")